Quick gut-check: are you closing the same mix of refinance loans the market is producing… or just the ones you’re set up to sell?
Most lenders don’t lose refinance volume because they “missed the rate window.” They lose it because their program coverage and messaging coverage are narrow. They’re over-invested in a couple of familiar lanes, and under-invested in the rest of the demand that’s consistently closing every week.
That blind spot doesn’t show up as one dramatic failure. It shows up as slow leaks: higher acquisition costs, lower pull-through, and a pipeline that feels “unpredictable” even when market demand is hiding in plain sight.
And just to be clear: this isn’t a criticism of effort. It’s a critique of the default playbook. Most lender growth strategies are built like this:
- Pick one or two programs the team is comfortable selling
- Build marketing around one dominant message
- Hope the market cooperates
That’s not a strategy. That’s dependency.
What the market is doing (and why your pipeline should reflect it)
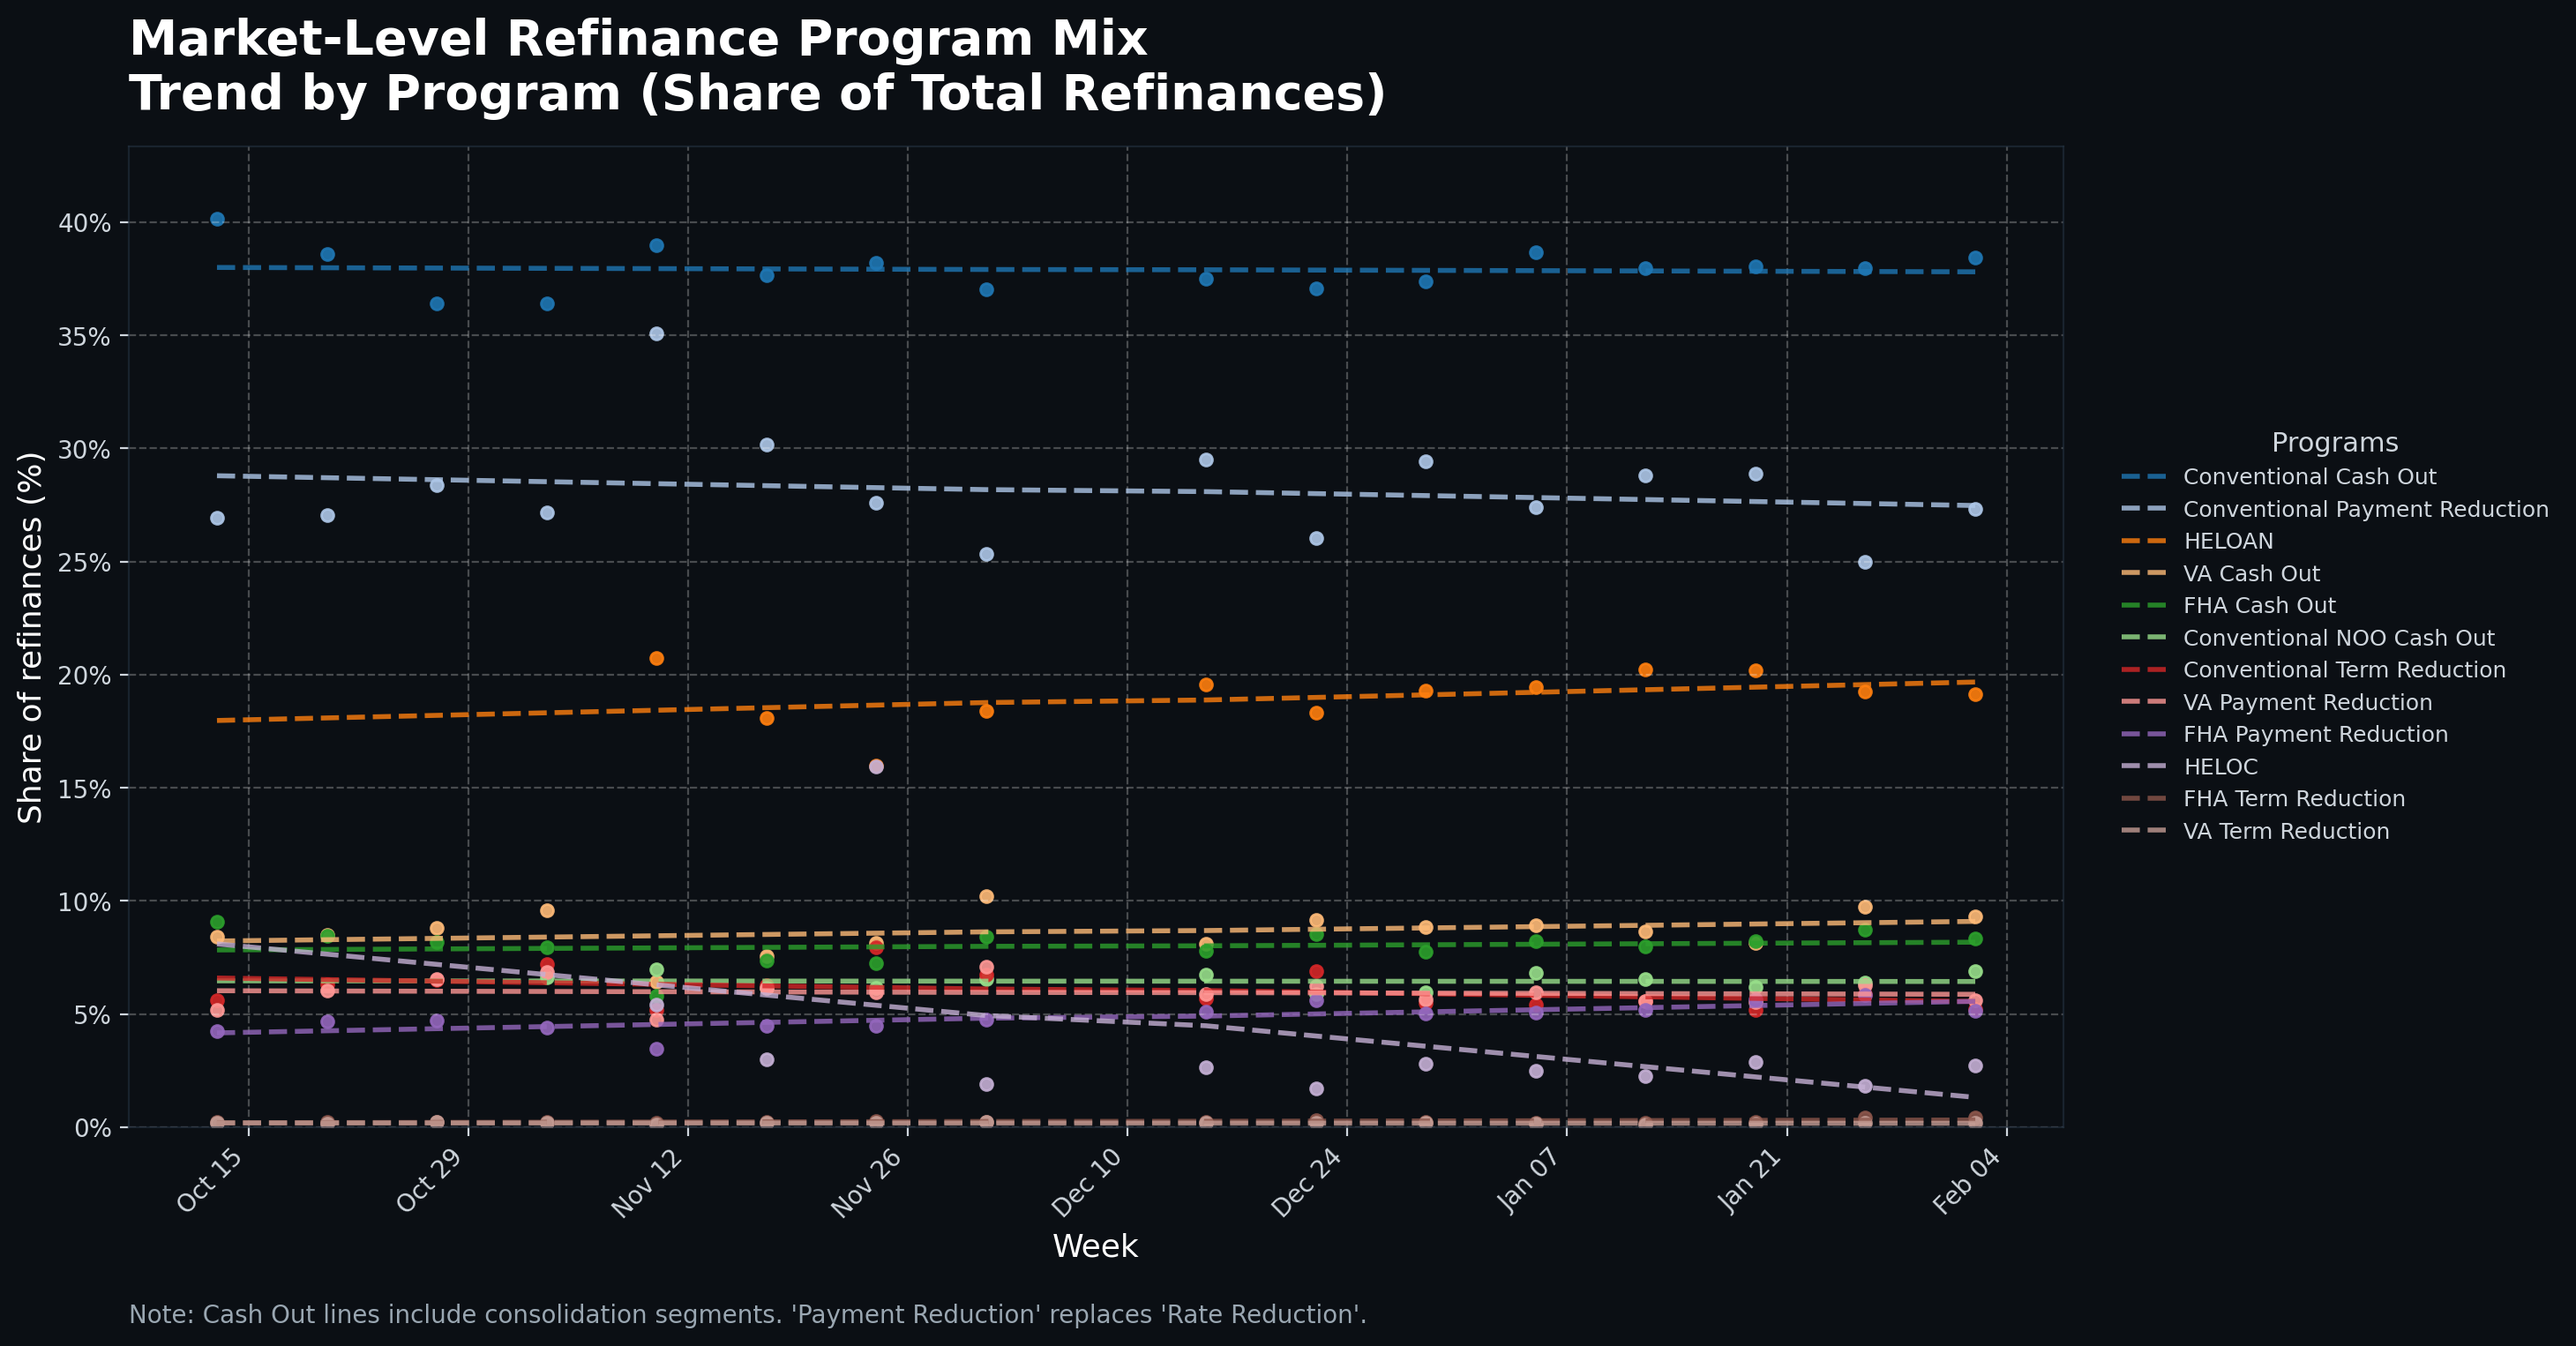
Below is a market-level view of refinance activity by program mix, tracked week over week. It’s simple to read, and it makes one point painfully obvious.
- Each line = a refinance program
- Each dot = that program’s weekly share of total refinances
- Each dashed line = the trend direction over time
- Cash-out “consolidation” segments have been rolled into Cash Out by loan program (Conventional/FHA/VA/NOO) so the picture reflects how most lenders actually operationalize it.
The “big rocks” you can’t ignore
Even with lots of program types in play, the market consistently concentrates on a few major areas:
- Conventional Cash Out (incl. consolidation) is the largest and most stable share in this dataset, hovering around the high-30% range week to week.
- Conventional Payment Reduction (formerly labeled “Rate Reduction”) also holds a significant share, averaging roughly 20%- 25%.
- HELOAN is also a meaningful slice, in the high teens and trending slightly upward.
Those three lanes alone account for a significant share of total refinance activity during this period. That’s the market telling you something important:
Borrowers are not behaving like one “refi audience.” They’re behaving like multiple audiences with different goals.
Then there’s a second tier that’s smaller but still highly relevant:
- VA Cash Out and FHA Cash Out each show a consistent share in the high single digits.
- Conventional NOO Cash Out (incl. consolidation) sits in the mid single digits and stays relatively steady.
- Conventional Term Reduction also shows up consistently, as another mid-single-digit lane that many lenders under-market.
And you can also see movement: for example, HELOC trends downward over the period, which is exactly why you can’t “set and forget” your strategy. Some segments drift. Others surge. But the market never collapses into one single program type.
The uncomfortable truth: most lenders don’t match the market mix
Most consumer-direct lenders are overweight a couple of programs and underweight everything else.
Not because they don’t care. Because the default approach encourages it:
- Marketing is built around the easiest message: “lower your rate.”
- Borrowers don’t actually buy rates — they buy outcomes
- So the better truth is payment reduction, not rate reduction
- Meanwhile, other motivations (equity needs, payoff goals, consolidation, risk) don’t get consistent coverage
So lenders end up stacked in a few lanes:
- A narrow version of payment reduction
- A narrow version of cash-out
- Maybe one government program; if they have a strong team
Meanwhile, the market keeps producing consistent volume in programs that require different messaging, different optioning, and sometimes different routing:
- term reduction, homeowners who care more about the payoff timeline than the monthly savings
- cash-out consolidation, homeowners who want structure and relief, not just “extra cash.”
- government cash-out borrowers with strong reasons to act
- NOO/investor opportunities that many teams never prioritize
Here’s the kicker: your competitors don’t need to beat your price to beat your pipeline. They just need to show up in more of the market than you do.
Why mismatch costs real money
1) You miss production because your message only speaks to one motivation
If your marketing is only “save money monthly,” you miss homeowners whose primary goal is:
- consolidating debt and simplifying payments
- funding a major life expense with equity
- paying off the mortgage sooner
- shifting risk or restructuring intelligently
These borrowers aren’t “not interested.” They’re interested in a different reason.
2) Your CPA climbs because you fight in the most crowded lane
When everyone markets the same message to the same audience, competition goes up, and costs follow.
Diversified coverage often improves economics because:
- Competition is lower in under-marketed lanes
- Conversion improves when messaging aligns to intent
- Sales cycles shorten when the homeowner’s goal is clear
3) Pull-through drops when sales scripts and optioning don’t match intent
Most LOs can pitch payment reduction. Fewer confidently run an optioning conversation that gives homeowners clarity.
If you present only one scenario, you force the borrower into a yes-or-no decision.
If you present two or three clear options, you give them agency, and agency converts.
The fix: run your refi like a portfolio
At Monster Lead Group, we push a principle that turns “random wins” into repeatable growth:
Marketing isn’t a campaign. It’s an investment portfolio.
A smart lender doesn’t bet the entire refi funnel on a single program, channel, or market condition. They build a Marketing Investment Portfolio with intentional coverage across the motivations and programs the market is actually producing.
That portfolio approach does three things:
- Diversifies demand so growth isn’t rate-dependent
- Matches messaging to homeowner intent so calls are warmer, and conversion improves
- Balances ROI and stability across changing market conditions
And to make it work, sales have to match it.
Instead of:
“Here’s your payment savings.”
Your best teams move to structured optioning:
- Option A: payment reduction
- Option B: keep payment similar, reduce term
- Option C: access equity (cash-out) with a clear purpose and constraint
That’s not being pushy. That’s being useful.
Action steps: the “Portfolio Check” every lender should run this week
If you want to turn this chart into production, do this internally:
Step 1: Pull your last 60–90 days of funded refinance loans
Not apps. Not leads. Funded.
Step 2: Categorize them by program/purpose
Use categories aligned to the chart: Conventional cash-out, FHA/VA cash-out, payment reduction, term reduction, NOO, HELOAN/HELOC, etc.
Step 3: Compare your funded mix to the market mix
Ask:
- Where are we overweight?
- Where are we missing entirely?
- Where is the market share steady, but we’re not closing?
Step 4: Identify your highest-opportunity gaps
Start with lanes that are:
- meaningful in market share
- consistent over time
- underrepresented in your funded mix
Step 5: Rebalance
This isn’t “run more ads.” It’s operational:
- Adjust targeting + creative to match homeowner intent
- Update LO talk tracks and optioning
- Route leads based on intent and LO strengths
- Track performance by program and optimize weekly
That’s how portfolio management works: smart adjustments, repeated consistently, compounding over time.
If your funded refi mix doesn’t resemble the market’s mix, you’re leaving production on the table and paying extra to fight in the noisiest lanes.
Want us to benchmark your funded mix vs. market demand and show your highest-opportunity gaps?
Let’s run the numbers. Monster Lead Group can help you build the program coverage, messaging, and execution strategy that turns rate dependency into a portfolio-driven pipeline.